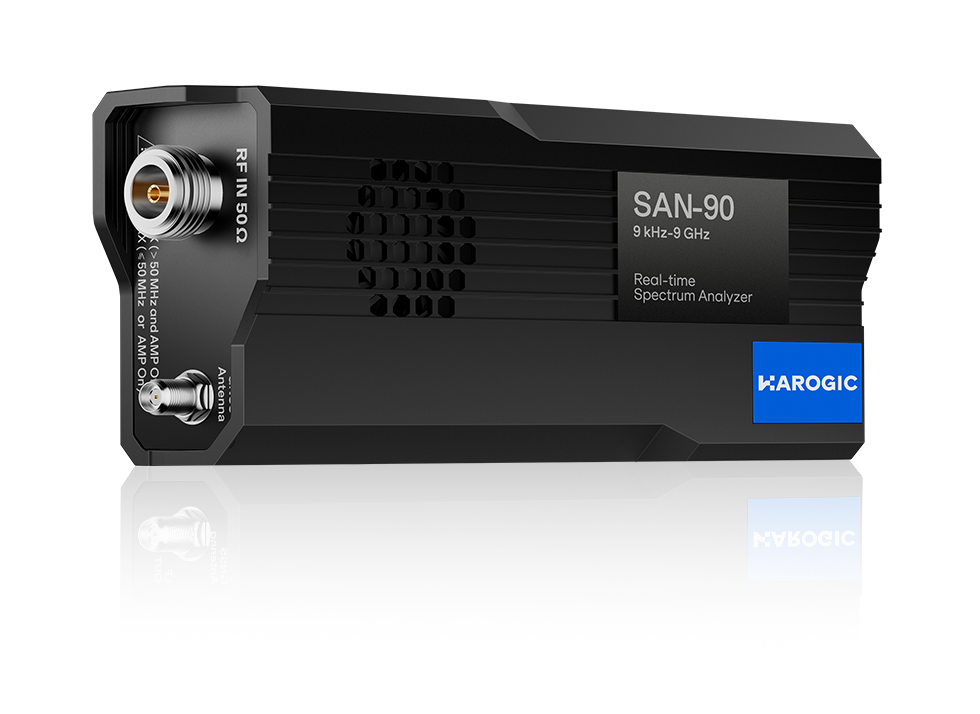
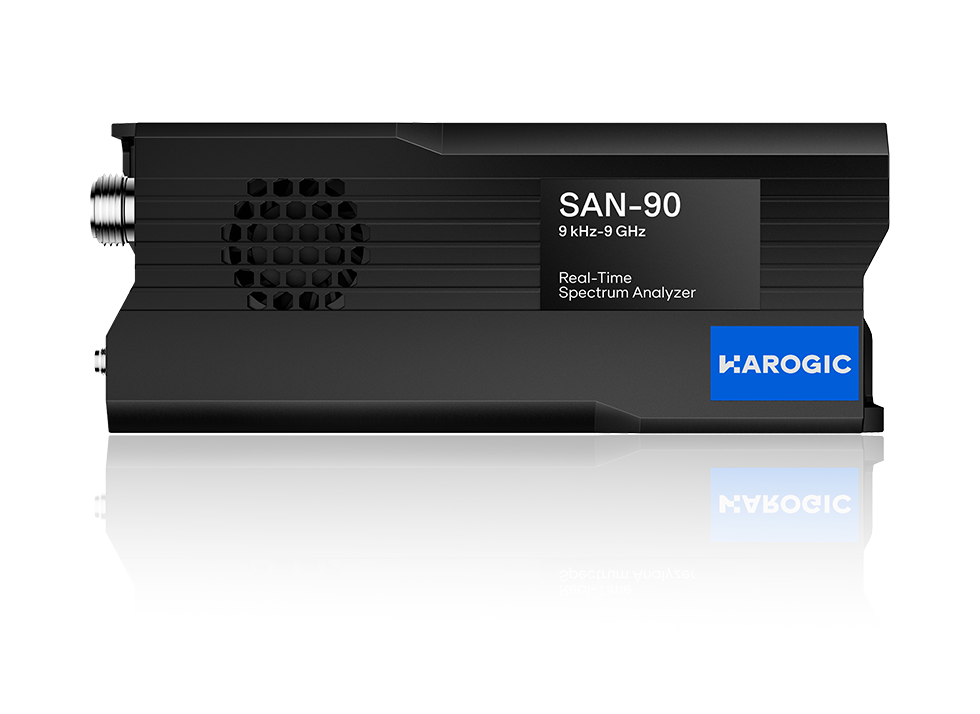
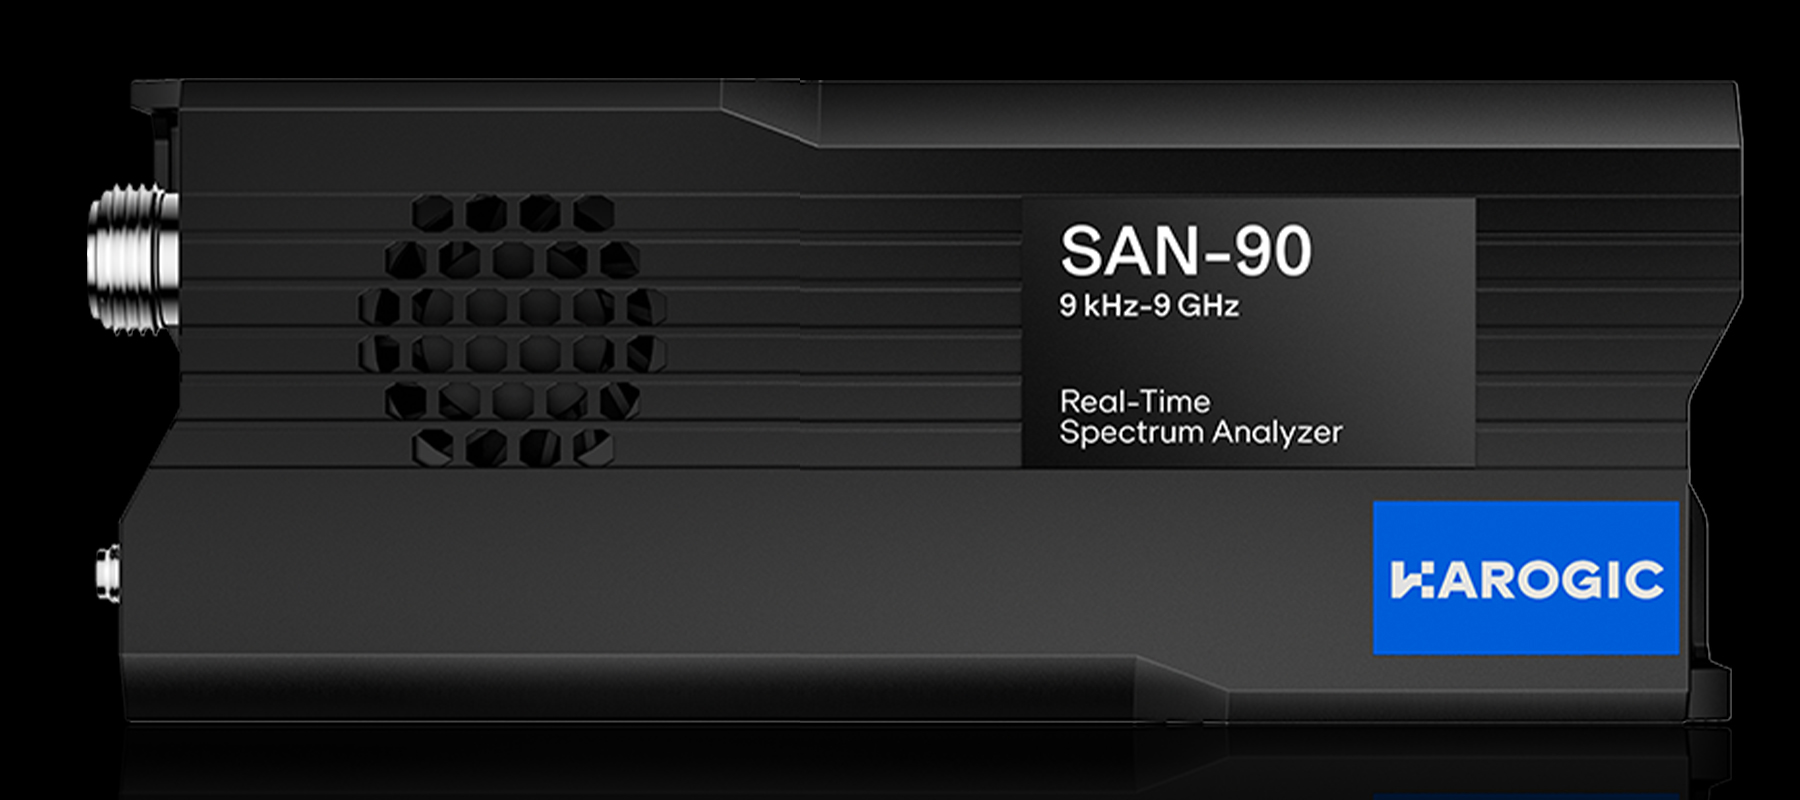
Spectrum Analyzer SAN Series
KEY FACTS
- High-performance superheterodyne receiver
- Frequency range: 9 kHz to 4.5/6/9 GHz
- IF and image rejection: >95 dBc (typ.)
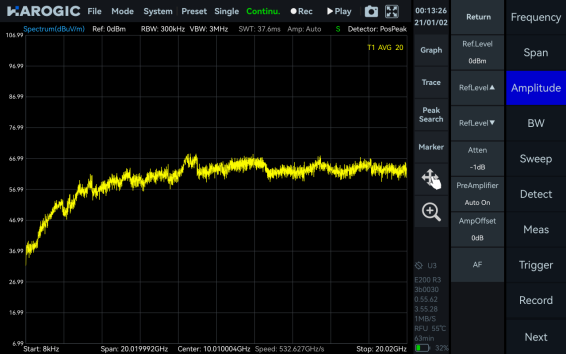
- 1 GHz DANL: -168 dBm/Hz (typ.)
- 1 GHz phase noise: <-110 dBc/Hz @ 10 kHz (typ.)
- 1 GHz phase noise measurement: <-125 dBc/Hz @ 10 kHz (typ.)
- Analysis bandwidth: 50 MHz / 100 MHz (opt) (typ.)
- Whole unit weighs just 420 grams / 163 x 66 x 37 mm
Benefits
Highlight
New HAROGIC SAN Series is a USB-based spectrum analyzer and receiver featuring a frequency range of 9 kHz up to 9 GHz. Designed to deliver high performance on a budget, the series includes essential measurement functions such as channel power, automatic harmonics, phase noise, and AM/FM analog demodulation. Furthermore, its highly compatible APIs facilitate seamless secondary development, offering customers exceptional versatility and value.
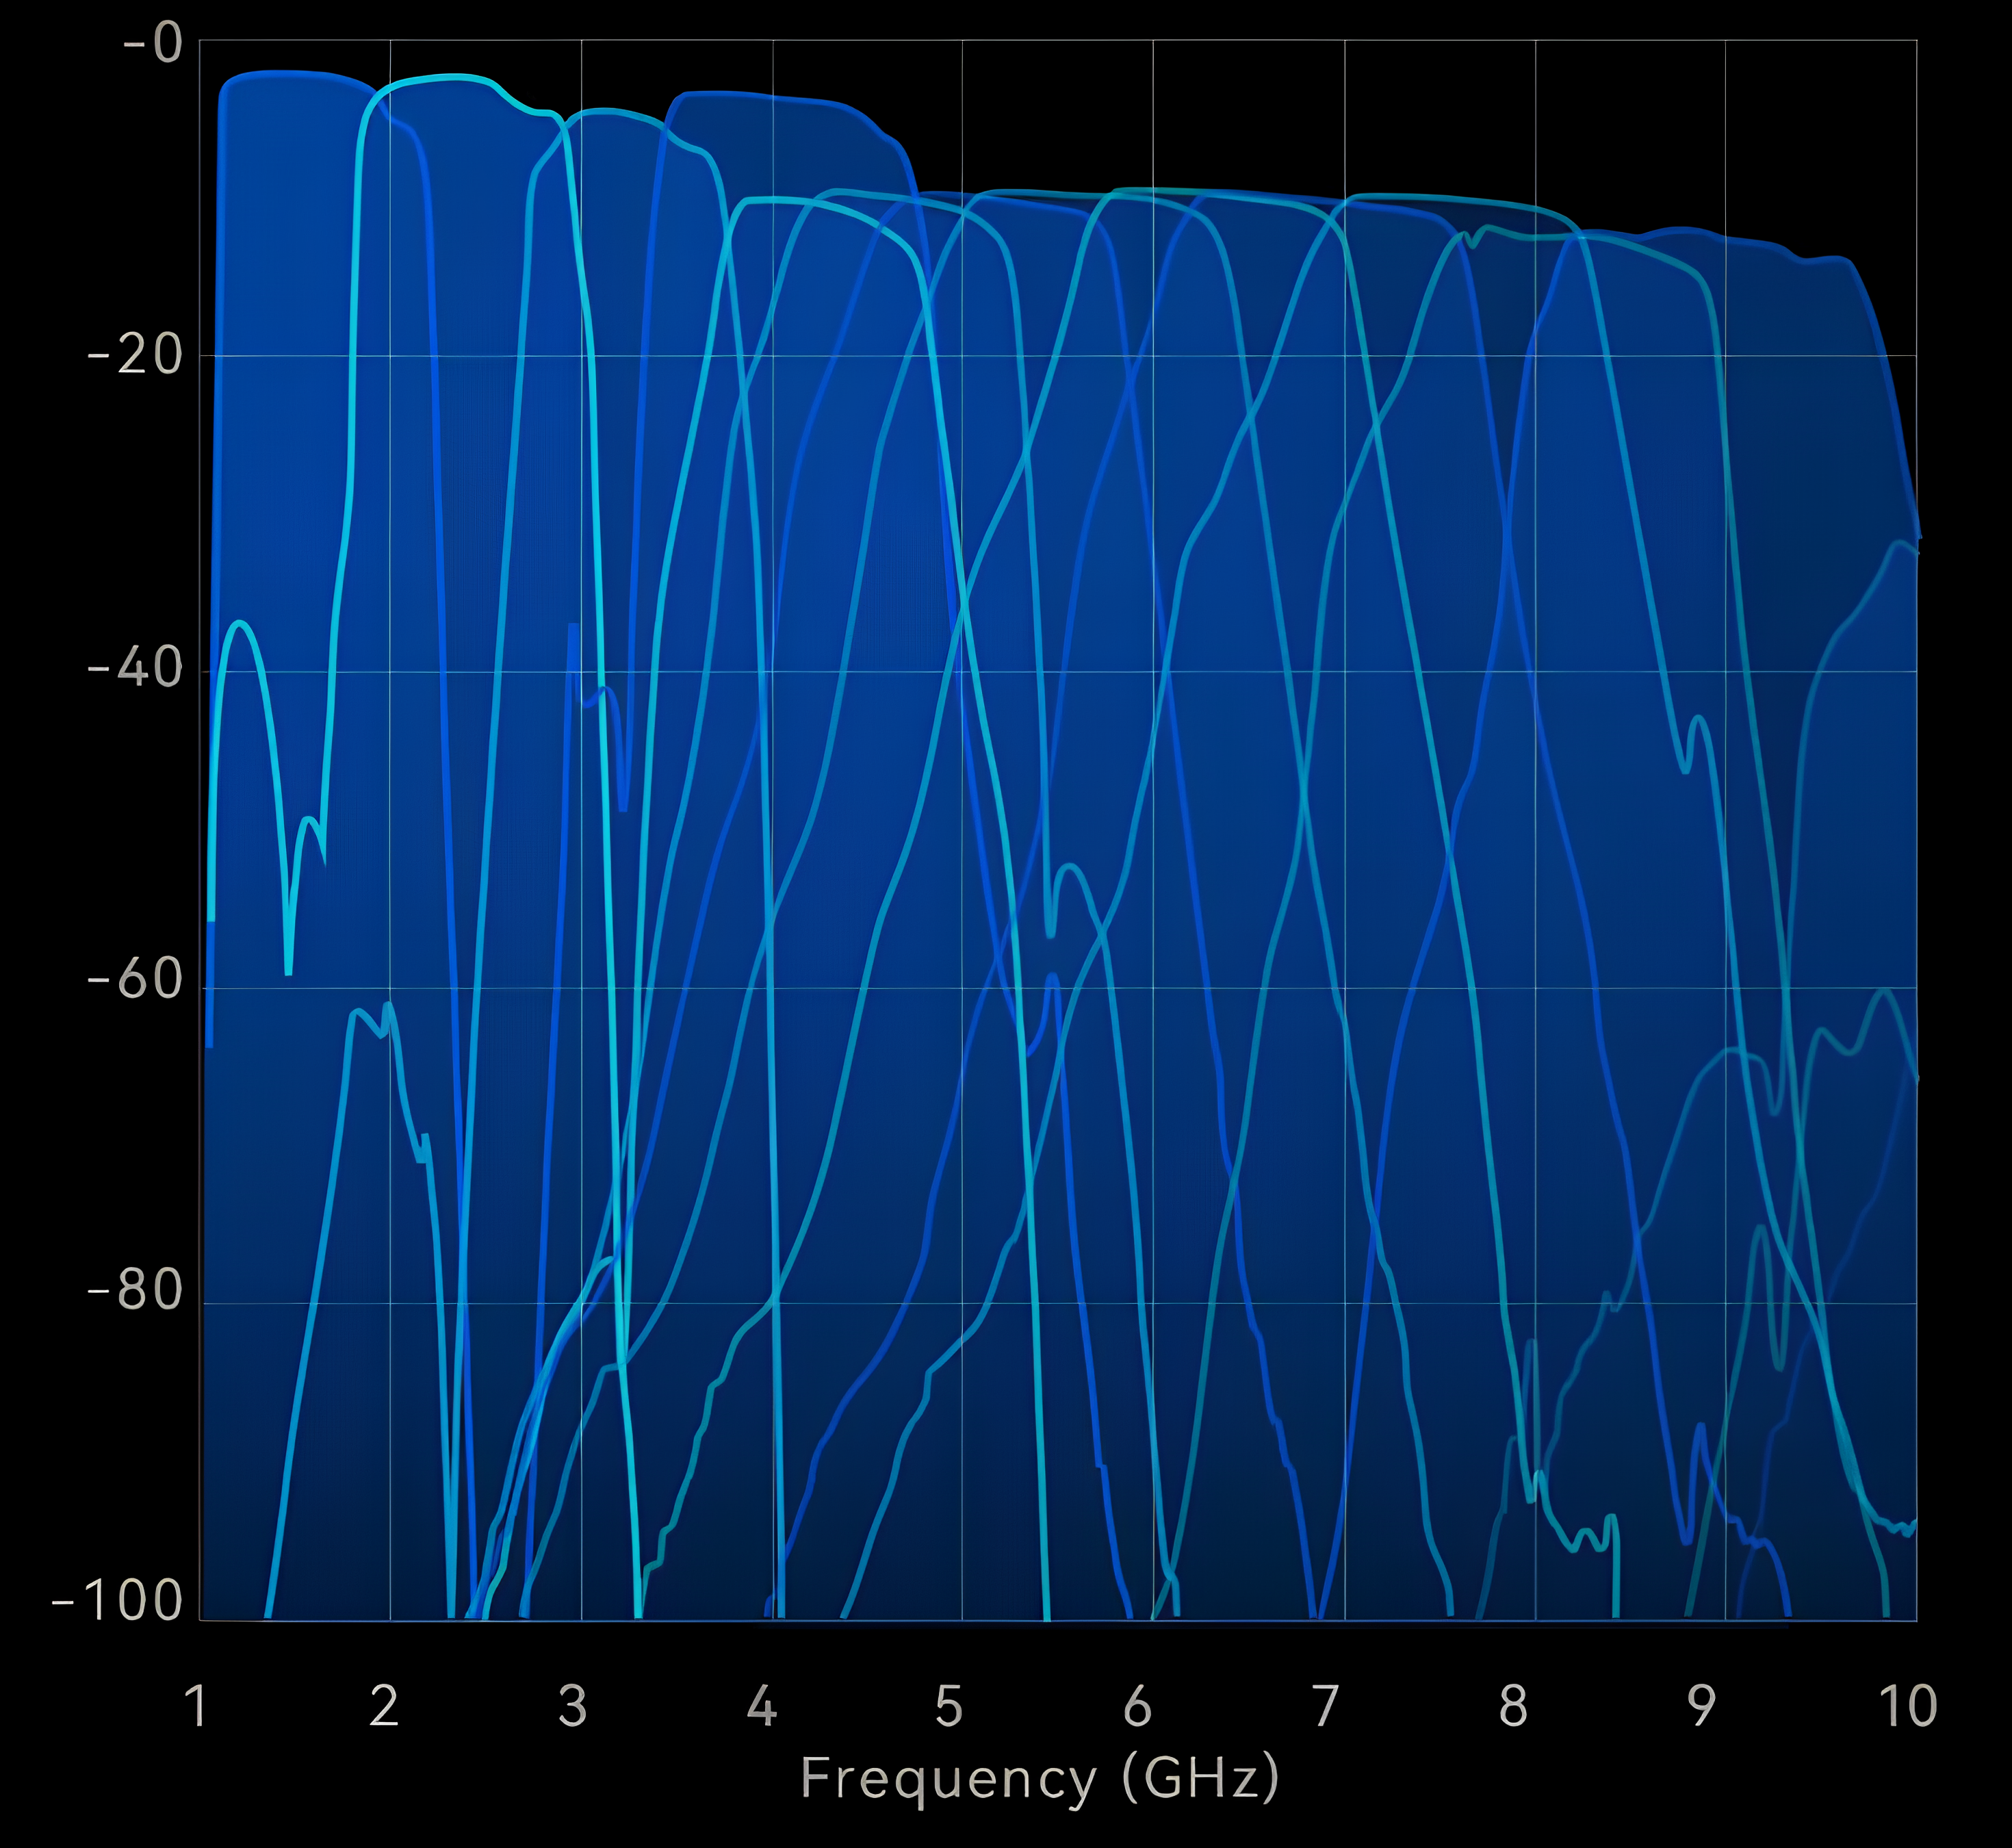
14-channel high-performance preselection
Effectively blocks false signals and interference
Image rejection
≥95 dBc
Intermediate frequency rejection
≥95 dBc
Amplitude (dBm)
Superior Performance-Everything You Need in One Place
1 GHz phase noise measurement
-125 dBc/Hz @ 10 kHz
Single-sideband phase measurement noise (dBc/Hz)
Offset Frequency (Hz)
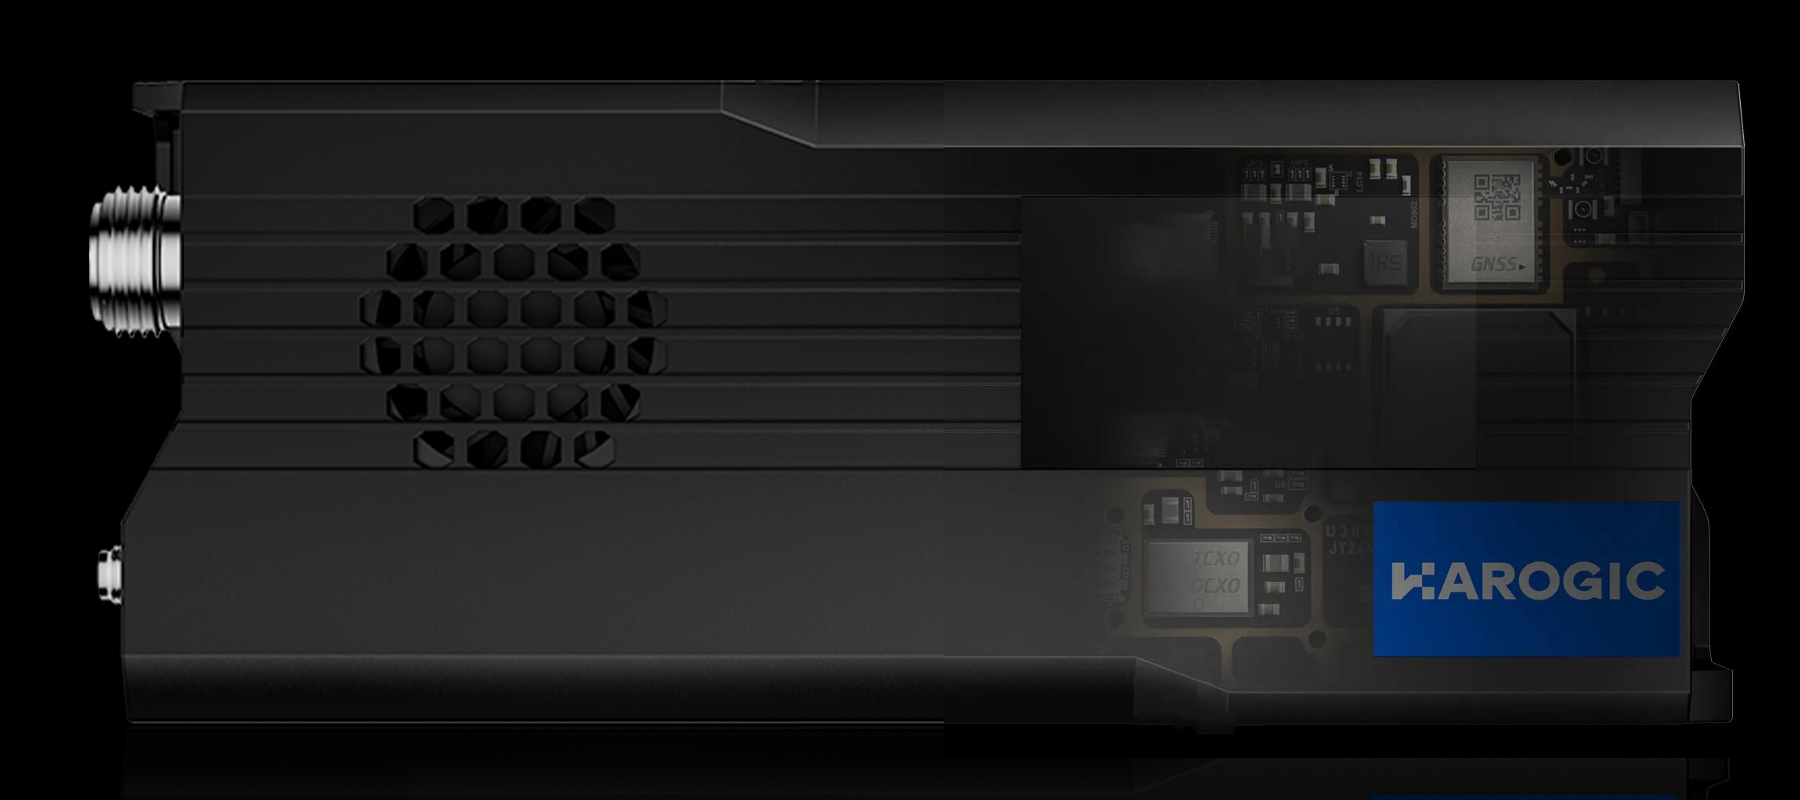
Precision Clock
Built-in GNSS positioning and timing
Initial frequency accuracy
≤0.5 ppm
Maximum GNSS correction accuracy
≤0.05 ppm
Frequency calibration made easy No more worries about time base drift
Comprehensive Measurement Modes to Meet Every Need
- Standard Spectrum Analysis mode
- IQ Streaming mode
- Power Detection Analysis mode
- Real-Time Spectrum Analysis mode
- Phase Noise Measurement
- Basic Vector Modulation Analysis mode (opt.71)
- Pulse Analysis (opt.72)
- Harmonic Analysis mode
- Mapping mode
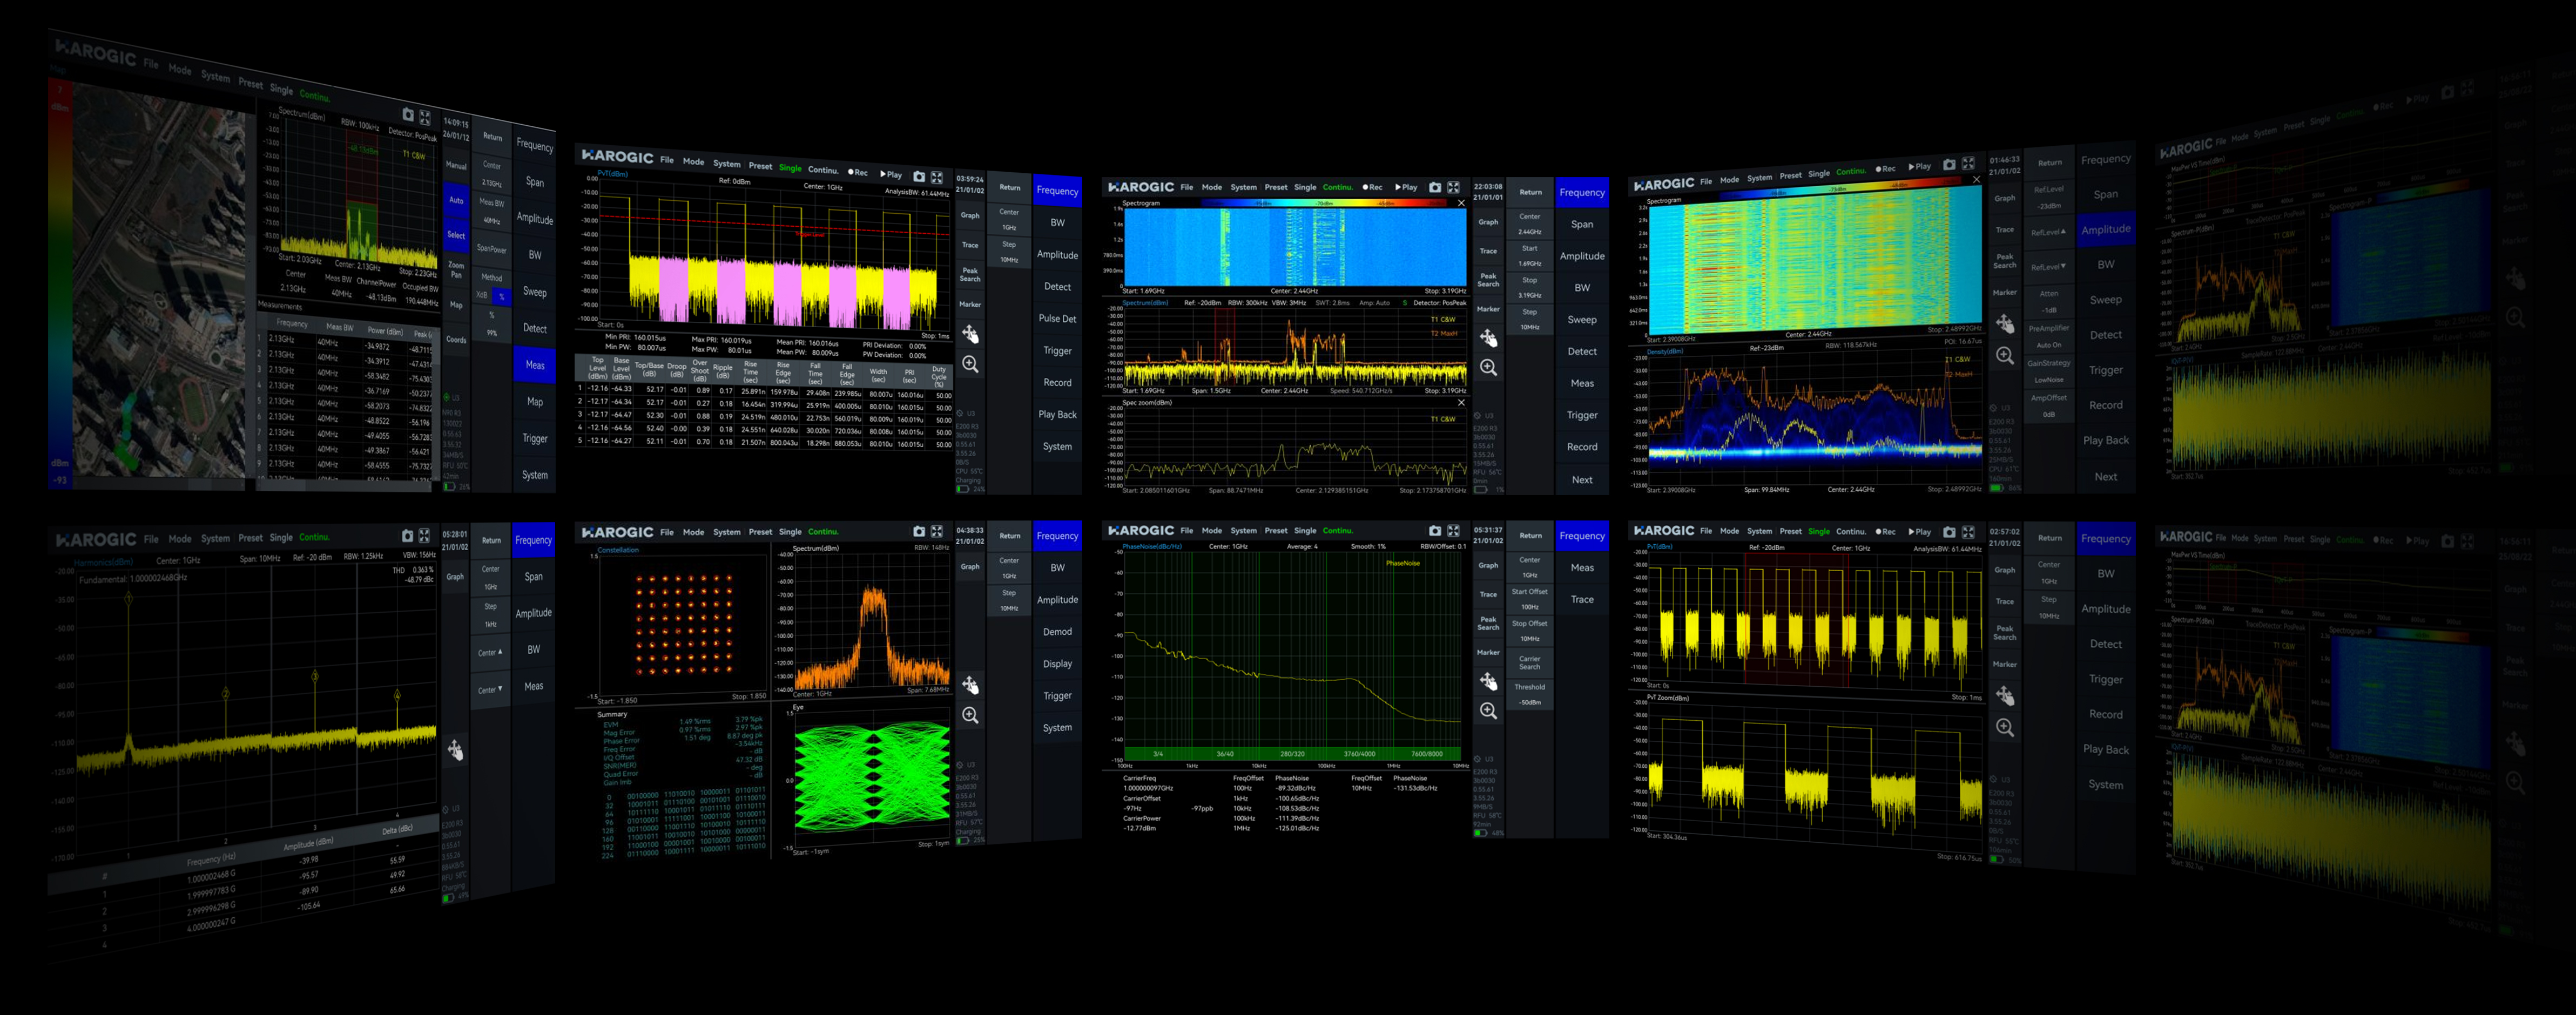
Main Functions Overview
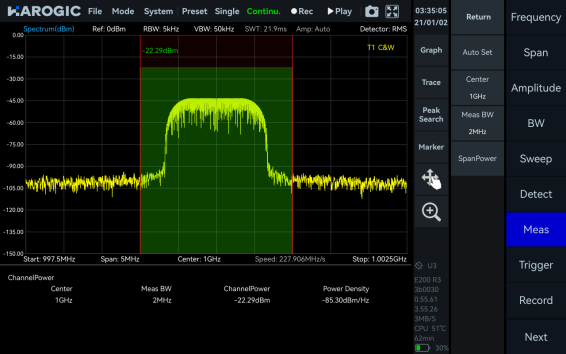
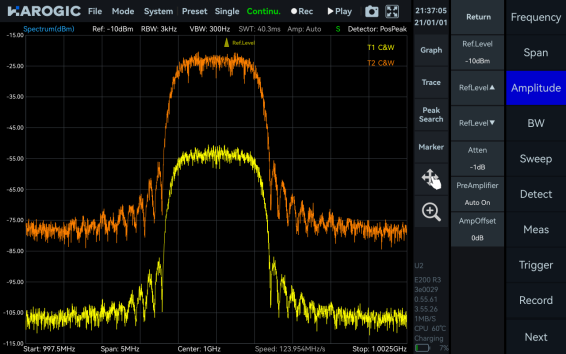
Channel Power
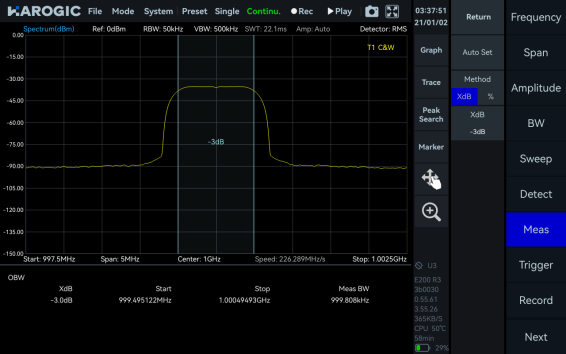
OBW
ACPR
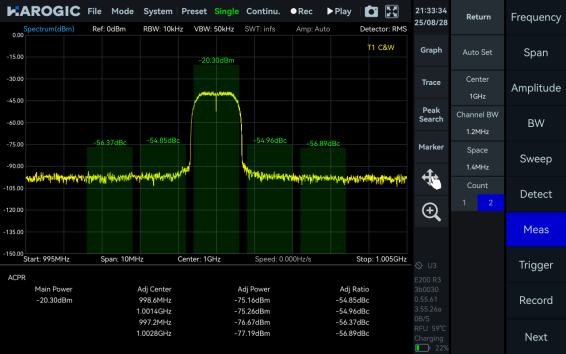
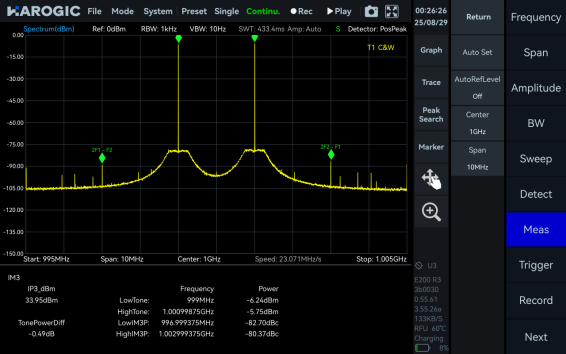
IM3
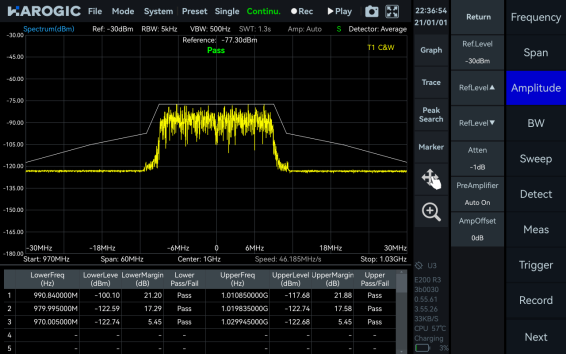
SEM
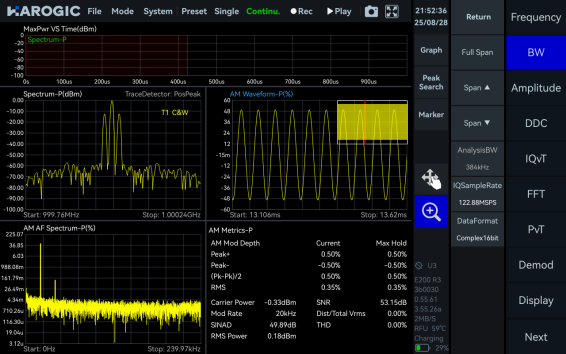
AM/FM Demodulation
Antenna Factor
Amplitude Offset
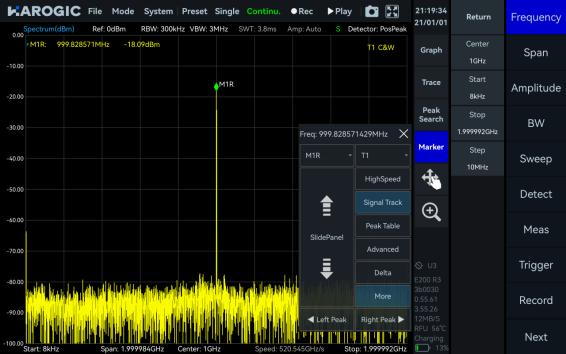
Signal Track
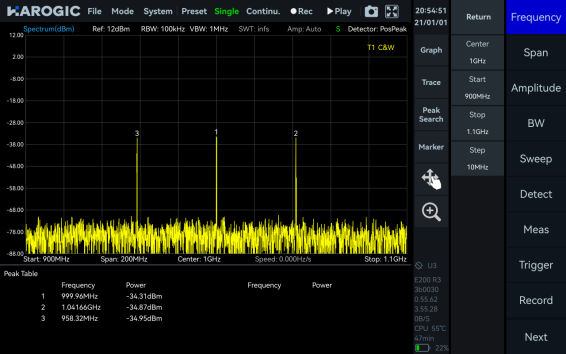
Peak Table
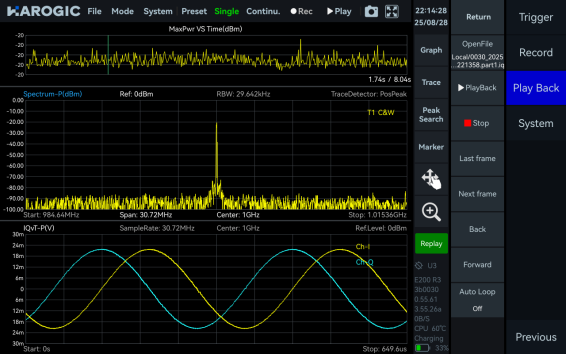
Data Record and Playback
Multiple Unit Display
Specifications*
Frequency
| SAN-45 | SAN-60 | SAN-90 | |
|---|---|---|---|
| Frequency range | 9 kHz to 4.5 GHz | 9 kHz to 6 GHz | 9 kHz to 9 GHz |
| Reference clock | Internal or external, manual correction or GNSS calibration is available | ||
| Frequency accuracy | TCXO (std.) | <0.5 ppm, manual correction is available | |
| OCXO (opt.01) | <0.2 ppm, manual correction is available | ||
| Frequency correction via GNSS | <0.05 ppm when GNSS is locked | ||
| Aging and temperature stability | TCXO (std.) | <1 ppm/year, <1 ppm | |
| OCXO (opt.01) | <1 ppm/year, <0.15 ppm | ||
| Built-in GNSS 1PPS accuracy | ± 100 ns | ||
Spectrum Purity
| SSB phase noise (dBc/Hz) Guaranteed/Typical | ||||
| Carrier frequency | 1 GHz | 4.5 GHz | 6 GHz | 9 GHz |
| 100 Hz | -85 / -88 | -78 / -81 | -75 / -78 | -74 / -77 |
| 1 kHz | -97 / -99 | -90 / -93 | -86 / -89 | -88 / -91 |
| 10 kHz | -110 / -112 | -103 / -106 | -100 / -103 | -99 / -102 |
| 100 kHz | -114 / -115 | -104 / -107 | -104 / -107 | -99 / -102 |
| 1 MHz | -131 / -132 | -119 / -122 | -118 / -121 | -116 / -119 |
| Residual response (dBm) RBW = 1 kHz Guaranteed/Typical | ||||
| Reference level (R.L.) | 0 dBm | -50 dBm | ||
| 9 kHz to 100 MHz | -90 / -94 | -115 / -117 | ||
| 100 MHz to 4.5 GHz | -90 / -95 | -120 / -128 | ||
| 4.5 GHz to 6 GHz | -90 / -96 | -120 / -130 | ||
| 6 GHz to 9 GHz | -90 / -98 | -120 / -129 | ||
| Image rejection | >90 dBc, >95 dBc (Typical) | |||
| IF rejection | >90 dBc, >95dBc (Typical) | |||
| Local oscillator related spurious | <-65 dBc Center frequency ± (N/M) × 125 MHz, N, M = 1, 2, 3, 4, 5… | |||
| IIP3/IIP2 (dBm) Typical | ||||
| Carrier frequency | 1 GHz | 4.5 GHz | 6 GHz | 9 GHz |
| R.L. = 20 dBm | 42/80 | 37/80 | 32/80 | 36/80 |
| R.L. = 0 dBm | 23/80 | 22/80 | 20/80 | 14/80 |
| R.L. = -20 dBm | 3/60 | 3/45 | -1/45 | -5/45 |
Amplitude
| Max. input power (CW) | 23 dBm | 50 MHz to maximum frequency and preamplifier is off | ||||
| 10 dBm | 9 kHz to 50 MHz or preamplifier is on | |||||
| Max. DC voltage | ±10 VDC | |||||
| Display range | DANL to 30 dBm | |||||
| Level accuracy | ± 1.0 dB from 20 oC to 30 oC typical conditions | ± 1.5 dB over full temperature range all conditions | ||||
| IF in-band flatness | < ±1.5 dB 50MHz analysis bandwidth | < ±2.0 dB 100MHz analysis bandwidth | ||||
| Reference level | -70 dBm to +23 dBm | |||||
| RF preamplifiers | Auto or manual | |||||
| VSWR | <2.0:1 Nominal, 90 MHz to Max. Frequency | |||||
| Display average noise level (DANL) dBm/Hz Guaranteed/Typical RBW=1kHz | ||||||
| SAN-45 | SAN-60 | SAN-90 | ||||
| Reference level | -20 dBm | -70 dBm | -20 dBm | -70 dBm | -20 dBm | -70 dBm |
| 9 kHz to 1 MHz | -131 / -134 | -141 / -144 | -131 / -134 | -141 / -144 | -131 / -134 | -141 / -144 |
| 1 MHz to 100 MHz | -151 / -154 | -163 / -166 | -151 / -154 | -163 / -166 | -151 / -154 | -163 / -166 |
| 100 MHz to 3.0 GHz | -141 / -144 | -165 / -168 | -141 / -144 | -165 / -168 | -141 / -144 | -165 / -168 |
| 3.0 GHz to 4.5 GHz | -142 / -145 | -165 / -168 | -142 / -145 | -165 /-168 | -142 / -145 | -165 / -168 |
| 4.5 GHz to 6 GHz | - | - | -143 / -146 | -165 / -168 | -143 / -146 | -165 / -168 |
| 6 GHz to 9 GHz | - | - | - | - | -144 / -147 | -164 / -167 |
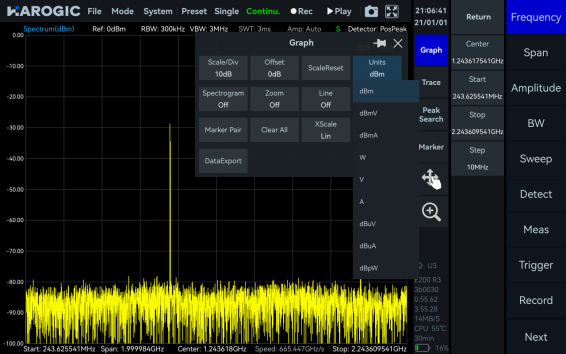
Standard Spectrum Analysis
| Detector | PosPeak, NegPeak, Sample, Average, RMS, MaxPower | ||
| RBW | 0.1 Hz to 10 MHz | ||
| VBW | 0.1 Hz to 10 MHz | ||
| Data chart | SAStudio4 software provides spectrum, spectrogram, historical trace | ||
| Measurements | Channel power, OBW, X dB bandwidth, Adjacent channel power ratio, IM3 | ||
| Sweep Speed | RBW = 250 kHz | FPGA processing | > 1 THz/s |
| RBW = 25 kHz | FPGA processing | > 300 GHz/s | |
| RBW = 1 kHz | CPU processing | > 4 GHz/s | |
IQ Recording
| Continuous recording bandwidth | Maximum: 50 MHz |
| Burst recording bandwidth | Maximum: 50 MHz / 100 MHz (opt.50) The built-in memory depth is 128 Mbytes |
| IQ sample rate | Maximum: 62.5 MSPS / 125 MSPS (opt.50) Decimate factor: 1, 2, 4, 8, 16, 32, 64, 128, 256, 512, 1024, 2048 |
| External trigger response | Maximum frequency response: 500 times/s |
Detection Analysis
| Min. time resolution | 16 ns / 8 ns (opt.50) |
| Max. analysis bandwidth | 50 MHz / 100 MHz (opt.50) |
| Detector | PosPeak, NegPeak, Sample, Average, RMS, MaxPower |
Real Time Spectrum Analysis
| FFT analysis | FFT engine is implemented in FPGA. Frame compression and trace detection are supported. No missing samples between FFT frames FFT frame update rate = 10 ^ 9 ns/(N × D × Minimum time resolution) POI = 2 × N × D × Minimum time resolution N for FFT points (4096, 2048, 1024, 512, 256, 128, 64, 32) D for decimate factor (1, 2, 4, 8...) |
||||
| Typical settings | FFT refresh rate (times/s) | 100%POI (us) | |||
| std. | opt.50 | std. | opt.50 | ||
| N = 4096, D = 1 | 15258 | 30517 | 131.072 | 65.536 | |
| N = 32, D = 1 | 1,953,125 | 3.906,250 | 1.024 | 0.512 | |
| Max. analysis bandwidth | 50 MHz / 100 MHz (opt.50) | ||||
| Window function | B-Nuttall, Flat-top, LowSideLobe, Kaiser | ||||
| RBW steps | ≥12 grades | ||||
| Amplitude resolution | 0.5 dB | ||||
General
| Input and output | ||
| RF input | N(F), impedance 50 Ω | |
| Power | Type-C, 5V 3A supply capacity voltage range 4.75 to 5.25 V, ripple less than 200 mVp | |
| USB port | Type-C, USB3.0 (USB2.0 bandwidth limited) Requires 5V 0.9A power supply | |
| External trigger input | Integrated in AUXIO, 3.3V CMOS, high impedance | |
| Trigger output | Integrated in AUXIO, 3.3V CMOS | |
| GNSS antenna input | SMA (F) | |
| Analog IF output | MMCX (F), maximum output power -25 dBm impedance 50 Ω, 312.5 MHz ± 50 MHz | |
| External reference clock input | MMCX(F), 10 MHz, Amplitude ≥ 1.5 Vpp, impedance 330 Ω | |
| Reference clock output | MMCX(F), 100 MHz, Amplitude ≥ 0.3 Vpp, programmable on/off | |
| Overall / core weight | ≤ 420 g / ≤ 195 g | |
| Overall / core dimensions (L × W × H) | ≤ 163 x 66 x 37 mm / ≤ 109 x 50 x 16 mm | |
| Power consumption | ≤ 20 W | |
| Packaging accessories | Flash disk * 1, USB 3.0 data cable * 1, USB power cable * 1, Power adapter * 1 | |
| System requirements | Windows 11/10/8/7(x86, x64), Debian 12/11/10(x64, AArch64) Ubuntu 24.04/22.04/20.04/18.04(x64, AArch64) | |
| Operating/Storage temperature (Ambient) | T0 class (std.) T1 class (opt.40) T2 class (opt.41), only core |
0 to 50 ℃ / -20 to +70 ℃ -20 to +65 ℃ / -40 to +85 ℃ -40 to +65 ℃ / -40 to +85 ℃ |
| Operating relative humidity | Ambient Temp.: 0 to 40 ℃ Ambient Temp.: >40 ℃ |
5 to 75% 5 to 45% |
Phase Noise Measurement
| Min. frequency offset | 1 Hz | |||
| Max. measurement frequency offset | 10 MHz | |||
| Trace smooth | Support | |||
| SSB phase noise (dBc/Hz) Guaranteed/Typical | ||||
| Carrier frequency | 1 GHz | 4.5 GHz | 6 GHz | 9 GHz |
| 100 Hz | -90 / -94 | -80 / -83 | -80 / -83 | -78 / -81 |
| 1 kHz | -113 / -117 | -102 / -105 | -100 /-103 | -95 / -98 |
| 10 kHz | -120 / -125 | -112 / -115 | -109 / -112 | -106 / -109 |
| 100 kHz | -126 / -129 | -114 / -117 | -111 / -114 | -108 / -111 |
| 1 MHz | -136 / -139 | -125 / -128 | -123 / -126 | -119 / -122 |
| 10 MHz | -140 / -143 | -137 / -140 | -137 /-140 | -136 / -139 |
Pulse Detection
| Min. pulse width | 64 ns / 32 ns (opt.50) |
| Measurement parameters | Top Level, Base Level, Top/Base, Droop, OverShoot, Ripple, Rise Time, Rise Edge, Fall Time, Fall Edge, Width, PRI, Duty Cycle |
AM Demodulation
| Measurement parameters | Modulation depth, carrier power, modulation rate, signal-to-noise ratio, RMS power, total harmonic distortion, etc. |
| Modulation rate test range | 20 Hz to 10 MHz |
| Modulation rate test accuracy | < 1 Hz when modulation rate < 1 kHz < 0.1% when modulation rate ≥ 1 kHz |
| Modulation depth test range and accuracy | 5% to 95%, ±5% (Nominal) |
FM Demodulation
| Measurement parameters | Modulation frequency offset, carrier power, modulation rate, signal-to-noise ratio, RMS power, total harmonic distortion, etc. |
| Modulation rate test range | 20 Hz to 2 MHz |
| Modulation rate test accuracy | < 1 Hz when modulation rate < 1 kHz < 0.1% when modulation rate ≥ 1 kHz |
| Frequency offset test range and accuracy | 1 kHz to 10 MHz, ±6% (Nominal) |
Basic Vector Modulation Analysis
| Modulation type | ASK: 2ASK FSK: 2FSK, 4FSK MSK: GMSK PSK: BPSK, QPSK, 8PSK QAM: 16QAM, 32QAM, 64QAM, 128QAM, 256QAM |
| Symbol length | 128 QAM and 256 QAM: 4000 Others: 2000 |
| Symbol rate | (1/64 to 1/4) * sample rate, ≤ 32.5MSPS |
| Filter | Root raised cosine |
| Filter roll-off factor | 0.01 to 0.99 |
| Display | Spectrum, constellation, eye diagrams, measurement results |
| Measurement | EVM, amplitude error, phase error, frequency error, signal-to-noise ratio, part of the bitstream |